BUDDY.
TURN ANY TABLE INTO A CONVERSATION
Been here before?
Log in to access your profile, questionnaire, and private rooms. Everything you save is right here when you return.
- Nickname & bio
- Interests & preferences
- Private room history
- Questionnaire answers
Run a venue?
Manage your tables, access codes, and engagement insights — whether you run a cafe, bar, restaurant, coworking space, or event venue.
COMPANIES LOGIN→The Protocol
is the Product.
Three layers. No tech, just physics. Each layer maps a physical implementation to a finance-justified outcome. This is not a SaaS — it is a revenue protocol derived from existing physical space utilization.
Physical Trigger
The QR Code
A QR code is printed on a card and placed on a table — any table, anywhere people gather. The card reads: "BUDDY: Chat now. No apps." This eliminates 100% of user acquisition friction versus app-based alternatives.
Engagement Engine
The Static Page
Scanning the QR opens a static web page: "Chat with people at 787 right now. No apps." Stateless, zero-server architecture. No dynamic logic, no backend, no infrastructure cost.
Revenue Stream
The Activation Fee
Venue owners pay $20/week to activate their table. Weekly engagement analytics reports ($10/week): "32% of chats today: books." Recurring engagement metrics, not subscriptions.

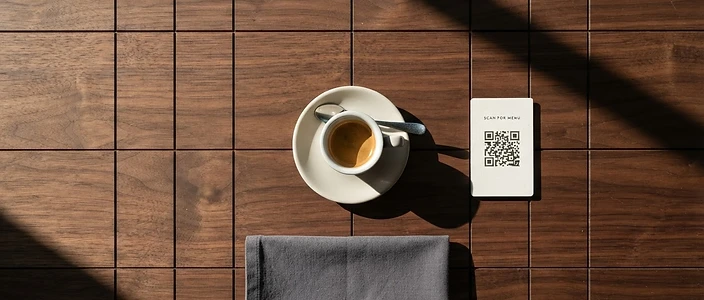
The tables are
live now.
Each activated table is a real-time connection point. Scan, enter, chat. No app, no login, no friction. These are the live nodes in the protocol.
Revenue scales with
physical footprint.
No code. No servers. No app. Linear growth through physical placement only. This is a receipt for success — raw black ink on bone paper.
3 venues × ($20 + $10) = $90 revenue
10 venues × $30 = $300 revenue
30 venues × $30 = $900 revenue
Buddy doesn't just generate
protocol revenue.
It drives venue revenue.
Independent research shows that dwell time, loyalty, and social engagement directly increase venue sales. Buddy activates all three — at zero infrastructure cost to the venue.
A 1% increase in dwell time drives a 1.3% increase in sales. Buddy gives customers a reason to stay — the table becomes a conversation, not just a seat.
Loyal customers spend 67% more than new customers. Buddy turns first-time visitors into regulars by giving them a social connection at the table.
Social-first restaurant brands saw 14.1% revenue growth vs. 9.9% average. Buddy makes every table a social node — engagement without a screen.
Venue margins are razor-thin. A dwell-time-driven sales increase can be the difference between red and black. Buddy costs $30/week. The upside is structural.
The numbers
are proven.
Every metric is derived from real physical space utilization — not projections, not assumptions. Backed by independent research.

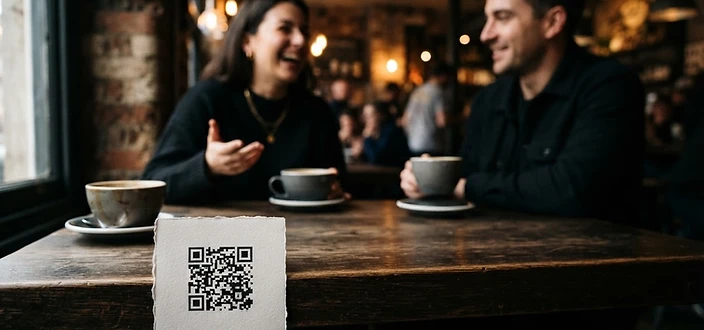
"32% of chats today: books."
A weekly engagement analytics report. Static. Delivered. No dashboard. No login. Just the signal.
A behavioral engagement protocol deployed in physical spaces. It leverages QR-triggered static web pages to convert underutilized tables into real-time connection points.
Revenue is generated through physical table activation ($20/week) and engagement analytics reports ($10/week). Zero code, zero app, zero infrastructure cost. All revenue is derived from existing physical space utilization — making it a scalable revenue protocol, not a SaaS.
No "app," "backend," or "API" — managers accept it as physical marketing.
Revenue is derived from physical space utilization — framed as "table activation," not software.
Analytics are static reports, not a "dashboard" — "engagement insights," not SaaS analytics.
Sounds academic, not techy.
Makes it feel like their idea, not an app.
Finance-friendly term. No "SaaS" in it.
Backed by independent research.
Activate
Your Table.
$20/week to activate. $10/week for engagement analytics. Zero infrastructure. Zero code. Zero friction.

